Cres and Little problem
Ramp Reflection
|
|
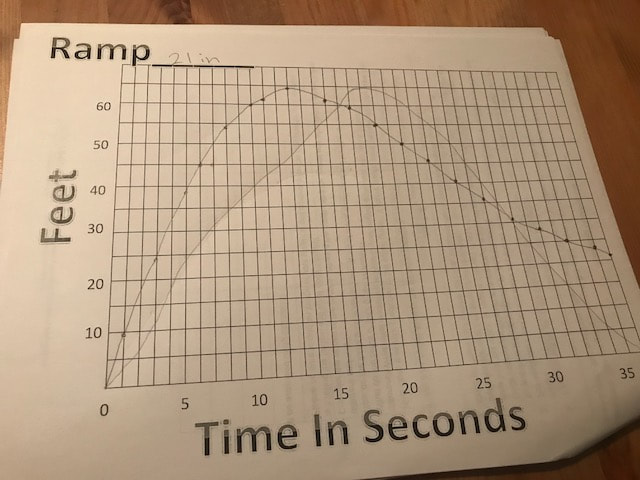
A) How close was your prediction to the actual graph? If you're graphs were different then why were they different? What initial reasoning led you to your original graph and why was it different? My graphs gradually got more accurate over time. They were sometimes different since I wasn't paying enough attention to the distance or time. It was mainly just guess and check work, but I made an educated guess.
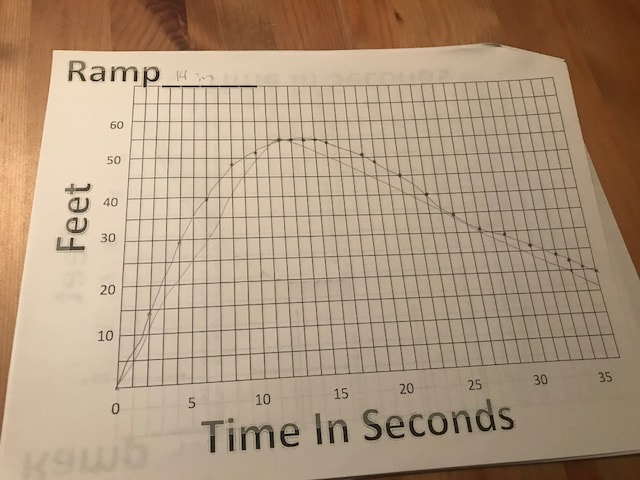
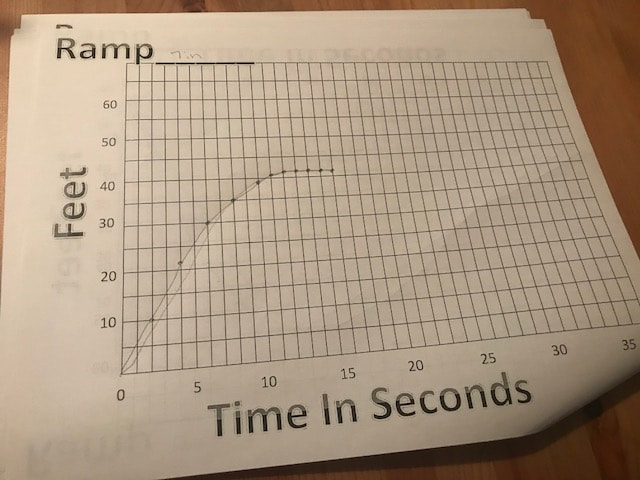
B) What do the zeros of your graph represent? The zeros of my graph represent the starting time and distance of the skateboard C) How do the three graphs compare in terms of zeros, maximums and minimums? What's similar and different and why? All three of these graphs all gradually increase in time and distance, but as time goes on, the distance will slowly start to decrease. They all decrease at different rates, except for the 7" one where the video was cut short before it could go backwards again. The max and mins are obviously all different since they all had different ramp heights D) Consider the slopes of the graphs. When is the graph rising the fastest and what does it mean? When is it falling the fastest and what does it mean? All the graphs seem to rise fast around the middle point of their different times and they. For the decrease, they end up plateauing and then decreasing over time. |